隠れ層(中間層)を用いた3色分類

前回と同様の手順で下図のように塗り分けられたデータを分類してみました。

f:id:S_E_Hyphen:20170503085651p:plain

ですよねぇ。

青点が両側に分離されてしまってますから、緑や赤との境界が決まりません。

「全部、青」と言われれば「そうなのかなぁ」といったところです。


このようなデータでも「隠れ層(中間層)」と呼ばれる未知数を追加するだけで分類が可能となります。

num_units = 2

x=tf.placeholder(tf.float32,[None,1])

w1=tf.Variable(tf.truncated_normal([1,num_units]))
b1=tf.Variable(tf.zeros([num_units]))
hidden1=tf.nn.relu(tf.matmul(x,w1)+b1)
               
w0=tf.Variable(tf.zeros([num_units,3]))
b0=tf.Variable(tf.zeros([3]))
f=tf.matmul(hidden1,w0)+b0
p=tf.nn.softmax(f)

t=tf.placeholder(tf.float32,[None,3])
loss=-tf.reduce_sum(t*tf.log(tf.clip_by_value(p,1e-10,1.0)))
train_step=tf.train.AdamOptimizer().minimize(loss)


赤で示した未知数w1、b1とプレースホルダーxから算出されるhidden1というのが隠れ層(中間層)と呼ばれるものです。前回出てきた一次関数f(w0,b0)の計算からソフトマックス関数の適用までと、瓜二つの繰り返しのように見えます。


このトレーニングを十分に繰り返したあとのhidden1の値の分布を示します。

f:id:S_E_Hyphen:20170503092230p:plain

num_units=2としているので、hidden1は2次元となっています。横軸はhidden1[ 0 ]、縦軸はhidden1[ 1 ]です。

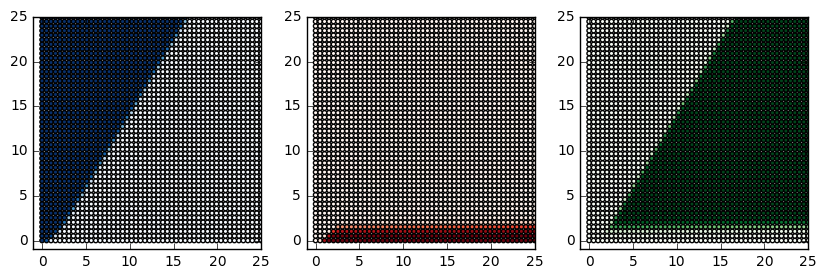
-5<=x<=5で50分割したものを入力して計算したhidden1の値を打点しました。x=-5はhidden1=(0,0)に変換されるようです。逆にx=+5はhidden1=(15,25)に変換されます。

すなわち、この中間層はX軸を2次元上の曲線(あるいは2つの線分)に変換していたのです。

こうなってしまえば、正負で分離されていたと思われた青点も平面上の一つの直線の同じ側として一括りに扱うことが可能となります。
f:id:S_E_Hyphen:20170503093751p:plain

そうなるように適切にw0とb0を求めて、青赤緑それぞれの確率を計算して描画します。

f:id:S_E_Hyphen:20170503100607p:plain

隠れ層(中間層)を使用することで、複雑な領域分けが可能となりました。


# coding: utf-8

# In[ ]:

import tensorflow as tf
import numpy as np
import matplotlib.pyplot as plt
from numpy.random import multivariate_normal, permutation
import pandas as pd
from pandas import DataFrame, Series

np.random.seed(20170426)


# In[ ]:

num_train=300
x=np.random.rand(num_train)*10-5
t=np.zeros( (num_train,3) )
df=DataFrame(np.c_[x,t],columns=['x','blue','red','green'])

for i in range(num_train):
    if df.x[i]<-2.25:
        df.blue[i]=1
    elif df.x[i]>2.25:
        df.blue[i]=1
    elif df.x[i]<0:
        df.red[i]=1
    else:
        df.green[i]=1
#データフレームから行列変換します。train_tはOne-Hot表現にしています。
train_x=df['x'].as_matrix().reshape([len(df),1])
train_t=df[ ['blue','red','green'] ].as_matrix().reshape([len(df),3])


# In[ ]:

fig = plt.figure(figsize=(3,3))
subplot = fig.add_subplot(1,1,1)
subplot.set_xlim([-5,5])
subplot.set_ylim([-1,1.5])
red=df[df.red==1]
subplot.scatter(red.x,-0.5*red.red+0.05, color='r', marker='o')
blue=df[df.blue==1]
subplot.scatter(blue.x,-0.5*blue.blue-0.05, color='b', marker='o')
green=df[df.green==1]
subplot.scatter(green.x,-0.5*green.green, color='g', marker='o')


# In[ ]:

num_units = 2

x=tf.placeholder(tf.float32,[None,1])

w1=tf.Variable(tf.truncated_normal([1,num_units]))
b1=tf.Variable(tf.zeros([num_units]))
hidden1=tf.nn.relu(tf.matmul(x,w1)+b1)
               
w0=tf.Variable(tf.zeros([num_units,3]))
b0=tf.Variable(tf.zeros([3]))
f=tf.matmul(hidden1,w0)+b0
p=tf.nn.softmax(f)

t=tf.placeholder(tf.float32,[None,3])
loss=-tf.reduce_sum(t*tf.log(tf.clip_by_value(p,1e-10,1.0)))
train_step=tf.train.AdamOptimizer().minimize(loss)


# In[ ]:

sess=tf.Session()
sess.run(tf.initialize_all_variables())


# In[ ]:

i=0
#10000回トレーニングを実施します。
for _ in range(10000):
    i += 1
    sess.run(train_step,feed_dict={x:train_x, t:train_t})
    if i%1000==0:
        loss_var=sess.run(loss,feed_dict={x:train_x, t:train_t})
        print '%d:loss=%f' % (i,loss_var)


# In[ ]:

# 2ノードの隠れ層(中間層)で表現される仮想平面を描画します。
test_x=np.linspace(-5,5,50).reshape([50,1])
h_val=sess.run(hidden1,feed_dict={x:test_x})
plain=DataFrame(np.c_[test_x,h_val],columns=['x','x1','x2'])

p_val=sess.run(p,feed_dict={hidden1:h_val})
line=DataFrame(np.c_[h_val,p_val],columns=['x1','x2','blue','red','green'])

fig = plt.figure(figsize=(10,3))
subplot = fig.add_subplot(1,3,1)
subplot.set_xlim([-1,25])
subplot.set_ylim([-1,25])
subplot.scatter(line.x1,line.x2, s=10, c=line.blue, cmap='Blues')

subplot = fig.add_subplot(1,3,2)
subplot.set_xlim([-1,25])
subplot.set_ylim([-1,25])
subplot.scatter(line.x1,line.x2, s=10, c=line.red, cmap='Reds')

subplot = fig.add_subplot(1,3,3)
subplot.set_xlim([-1,25])
subplot.set_ylim([-1,25])
subplot.scatter(line.x1,line.x2, s=10, c=line.green, cmap='Greens')


# In[ ]:

# 仮想平面と青赤緑の関係です。
plane=[]
for x2 in np.linspace(0,25,50):
    for x1 in np.linspace(0,25,50):
        plane.append( (x1,x2) )
p_val=sess.run(p,feed_dict={hidden1:plane})
image=DataFrame(np.c_[plane,p_val],columns=['x1','x2','blue','red','green'])

fig = plt.figure(figsize=(10,3))
subplot = fig.add_subplot(1,3,1)
subplot.set_xlim([-1,25])
subplot.set_ylim([-1,25])
subplot.scatter(image.x1,image.x2, s=10, c=image.blue, cmap='Blues')

subplot = fig.add_subplot(1,3,2)
subplot.set_xlim([-1,25])
subplot.set_ylim([-1,25])
subplot.scatter(image.x1,image.x2, s=10, c=image.red, cmap='Reds')

subplot = fig.add_subplot(1,3,3)
subplot.set_xlim([-1,25])
subplot.set_ylim([-1,25])
subplot.scatter(image.x1,image.x2, s=10, c=image.green, cmap='Greens')


# In[ ]:

# テストデータとして-5から5を50分割したtest_xを作成します
# このテストデータで、青赤緑それぞれの確率を計算して描画します
test_x=np.linspace(-5,5,50).reshape([50,1])
p_val=sess.run(p,feed_dict={x:test_x})
line=DataFrame(np.c_[test_x,p_val],columns=['x','blue','red','green'])

fig = plt.figure(figsize=(3,3))
subplot = fig.add_subplot(1,1,1)
subplot.set_xlim([-5,5])
subplot.set_ylim([-1,1.5])
subplot.plot(line.x,line.blue,color='b')
subplot.plot(line.x,line.red,color='r')
subplot.plot(line.x,line.green,color='g')

red=df[df.red==1]
subplot.scatter(red.x,-0.5*red.red+0.05, color='r', marker='o')
blue=df[df.blue==1]
subplot.scatter(blue.x,-0.5*blue.blue-0.05, color='b', marker='o')
green=df[df.green==1]
subplot.scatter(green.x,-0.5*green.green, color='g', marker='o')


tensorflowによる3色分類の実施

ソフトマックス関数で3色の分類を実施してみました。


お決まりのモジュールのインポートです。

In [1]:
import tensorflow as tf
import numpy as np
import matplotlib.pyplot as plt
from numpy.random import multivariate_normal, permutation
import pandas as pd
from pandas import DataFrame, Series

np.random.seed(20170426)
 

平均値-1.5、分散1.3の正規乱数を100個発生させて青のデータセットとします。train_tは[1,0,0]となっています。

平均値0.5、分散0.8の正規乱数を100個発生させて赤のデータセットとします。train_tは[0,1,0]となっています。

平均値3.5、分散1.2の正規乱数を100個発生させて緑のデータセットとします。train_tは[0,0,1]となっています。

permutationを使って順番を入れ替えています。

In [2]:
#青のデータセット
num_train0=100
x0=np.random.normal(-1.5,1.3,num_train0)
t0=np.zeros((num_train0,3))
df0=DataFrame(np.c_[x0,t0],columns=['x','blue','red','green'])
df0['blue']=1

#赤のデータセット
num_train1=100
x1=np.random.normal(0.5,0.8,num_train1)
t1=np.zeros((num_train1,3))
df1=DataFrame(np.c_[x1,t1],columns=['x','blue','red','green'])
df1['red']=1

#緑のデータセット
num_train2=100
x2=np.random.normal(3.5,1.2,num_train2)
t2=np.zeros((num_train2,3))
df2=DataFrame(np.c_[x2,t2],columns=['x','blue','red','green'])
df2['green']=1
#繋ぎあわせて一つのデータフレームにします
df=pd.concat([df0,df1,df2],ignore_index=True)
df=df.reindex(permutation(df.index)).reset_index(drop=True)
#データフレームから行列変換します。train_tはOne-Hot表現にしています。
train_x=df['x'].as_matrix().reshape([len(df),1])
train_t=df[['blue','red','green']].as_matrix().reshape([len(df),3])
 

冗長ですが散布図を描いてみました。縦軸に意味はありません。

値の小さい方から青→赤→緑となっていますが、その境目は渾然としています。

この境界をソフトマックス関数で決定しようというのが狙いです。

In [3]:
fig = plt.figure(figsize=(3,3))
subplot = fig.add_subplot(1,1,1)
subplot.set_xlim([-5,5])
subplot.set_ylim([-1,1.5])
red=df[df.red==1]
subplot.scatter(red.x,-0.5*red.red+0.05, color='r', marker='o')
blue=df[df.blue==1]
subplot.scatter(blue.x,-0.5*blue.blue-0.05, color='b', marker='o')
green=df[df.green==1]
subplot.scatter(green.x,-0.5*green.green, color='g', marker='o')
Out[3]:
<matplotlib.collections.PathCollection at 0x6d28150>


xは300×1の行列です。300はデータセットの標本数です。

青、赤、緑の3つに分類するので、wとw0は3列となります。これは未知数です。

wとw0に適当な数値を仮定してf=x*w+w0という一次関数を計算します。

これにソフトマックス関数を適用することで、仮定したw,w0に対応する確率pを求めます。

プレースホルダーtにはtrain_tが代入されることとなります。

例えば実際に「青」であった場合t=[1 0 0]です。

t*log(p)を計算することにより、仮定したw,w0により「青」と推定された確率p[0]だけが意味を持つこととなります。

これの総和(reduce_sum)が最も良い値となるようにトレーニングを実施します。

In [4]:
x=tf.placeholder(tf.float32,[None,1])
w=tf.Variable(tf.zeros([1,3]))
w0=tf.Variable(tf.zeros([3]))
f=tf.matmul(x,w)+w0
p=tf.nn.softmax(f)

t=tf.placeholder(tf.float32,[None,3])
loss=-tf.reduce_sum(t*tf.log(p))
train_step=tf.train.AdamOptimizer().minimize(loss)
In [5]:
sess=tf.Session()
sess.run(tf.initialize_all_variables())
 

10000回トレーニングを実施します。

テストデータとして-5から5を50分割したtest_xを作成しました。

このテストデータで、青赤緑それぞれの確率を計算して描画します

In [6]:
#10000回トレーニングを実施します。
for _ in range(10000):
    sess.run(train_step,feed_dict={x:train_x, t:train_t})
    
# テストデータとして-5から5を50分割したtest_xを作成します
# このテストデータで、青赤緑それぞれの確率を計算して描画します
test_x=np.linspace(-5,5,50).reshape([50,1])
p_val=sess.run(p,feed_dict={x:test_x})
line=DataFrame(np.c_[test_x,p_val],columns=['x','blue','red','green'])

fig = plt.figure(figsize=(3,3))
subplot = fig.add_subplot(1,1,1)
subplot.set_xlim([-5,5])
subplot.set_ylim([-1,1.5])
subplot.plot(line.x,line.blue,color='b')
subplot.plot(line.x,line.red,color='r')
subplot.plot(line.x,line.green,color='g')

red=df[df.red==1]
subplot.scatter(red.x,-0.5*red.red+0.05, color='r', marker='o')
blue=df[df.blue==1]
subplot.scatter(blue.x,-0.5*blue.blue-0.05, color='b', marker='o')
green=df[df.green==1]
subplot.scatter(green.x,-0.5*green.green, color='g', marker='o')
Out[6]:
<matplotlib.collections.PathCollection at 0x6d22710>


値の小さいうち、例えば-5から-3位までは青がほぼ100%で、赤や緑は0%です。

実際そのような値の赤点や緑点は存在しません。

赤点が存在し始める(より、やや小さな)-2位から赤の確率が上昇してきます。

同時に青の確率が下降し、概ね-0.2で両者は交差します

値の大きな青もあれば値の小さな赤もあるのですが、その境界は-0.2であったと断言することができるわけです。

同様に赤と緑の境界は+1.8であったと言い切れます。

このようにソフトマックス関数を適用することで渾然としたデータの境界を決定することが可能となります。

tensorflowで三角関数近似


周期1年のサイン関数で近似してみました。作成にあたっては以下の文献を参考にさせていただきました。

中井悦司著「Tensorflowで学ぶディープラーニング入門」ISBN978-4-8399-6088-9


モジュールをインポートします。

In [1]:
import tensorflow as tf
import numpy as np
import matplotlib.pyplot as plt
 

Placeholder x を定義します。

In [2]:
x = tf.placeholder(tf.float32, [None, 3])
 

Variable w を定義します。

In [3]:
w = tf.Variable(tf.zeros([3, 1]))
 

計算式 y を定義します。

In [4]:
y = tf.matmul(x, w)
 

Placeholder t を定義します。

In [5]:
t = tf.placeholder(tf.float32, [None, 1])
 

誤差関数 loss を定義します。

In [6]:
loss = tf.reduce_sum(tf.square(y-t))
 

トレーニングアルゴリズム train_step を定義します。

In [7]:
train_step = tf.train.AdamOptimizer().minimize(loss)
 

セッションを用意して、Variableを初期化します。

In [8]:
sess = tf.Session()
sess.run(tf.initialize_all_variables())
 

トレーニングセットのデータを用意します。(実測値)

In [9]:
train_t = np.array([5.2, 5.7, 8.6, 14.9, 18.2, 20.4,
                    25.5, 26.4, 22.8, 17.5, 11.1, 6.6])
train_t = train_t.reshape([12,1])
 

トレーニングセットのデータを用意します。(モデル)

In [10]:
# (温度)=sin(30度*month+位相)+定数 でモデル化
train_x = np.zeros([12, 3])
cur=np.zeros([12,1])
for month in [1,2,3,4,5,6,7,8,9,10,11,12]:
    train_x[month-1][0]=1 # 定数
    train_x[month-1][1]=np.sin(30*month*3.141592/180) #  周期1年のSIN関数
    train_x[month-1][2]=np.cos(30*month*3.141592/180) #  周期1年のCOS関数
 

勾配降下法によるパラメーターの最適化を25000回繰り返します。

In [11]:
i = 0
sess.run(tf.initialize_all_variables())
for _ in range(25000):
    i += 1
    sess.run(train_step, feed_dict={x:train_x, t:train_t})
    if i % 1000 == 0:
        loss_val = sess.run(loss, feed_dict={x:train_x, t:train_t})
        print ('Step: %d, Loss: %f' % (i, loss_val))
print sess.run(w)
 
Step: 1000, Loss: 2935.489990
Step: 2000, Loss: 2488.358643
Step: 3000, Loss: 2093.184082
Step: 4000, Loss: 1744.432251
Step: 5000, Loss: 1438.418945
Step: 6000, Loss: 1172.378418
Step: 7000, Loss: 943.706543
Step: 8000, Loss: 749.378540
Step: 9000, Loss: 585.566284
Step: 10000, Loss: 447.873596
Step: 11000, Loss: 332.510803
Step: 12000, Loss: 237.278015
Step: 13000, Loss: 161.087250
Step: 14000, Loss: 102.957718
Step: 15000, Loss: 61.575798
Step: 16000, Loss: 35.087509
Step: 17000, Loss: 20.843044
Step: 18000, Loss: 15.194585
Step: 19000, Loss: 13.906918
Step: 20000, Loss: 13.797448
Step: 21000, Loss: 13.795701
Step: 22000, Loss: 13.795698
Step: 23000, Loss: 13.795697
Step: 24000, Loss: 13.795696
Step: 25000, Loss: 13.795695
[[ 15.24164963]
 [ -6.8297267 ]
 [ -7.76318884]]
 

トレーニング後のパラメーターを用いて、予測気温を計算する関数を定義します。

In [12]:
def predict(x):
    result = w[0] + w[1]*np.sin(30*x*3.141592/180) \
    + w[2]*np.cos(30*x*3.141592/180)
    return result
 

予測気温のグラフを描きます。

In [13]:
fig = plt.figure()
subplot = fig.add_subplot(1,1,1)
subplot.set_xlim(1,12)
subplot.scatter(range(1,13), train_t)
linex = np.linspace(1,12,100)
liney = sess.run(predict(linex))
subplot.plot(linex, liney)
Out[13]:
[<matplotlib.lines.Line2D at 0x6d7d1d0>]
 

robots統計

先述の乱数発生とgnurobotsおよびMySQLを組み合わせて、結果をデータベース化できるようにしてみました。

gnurobotsはエネルギー100、盾5で実行しています。

f:id:S_E_Hyphen:20170420153658p:plain


f:id:S_E_Hyphen:20170420155013p:plain

たくさん移動できた時は、盾が残っていてエネルギー切れで終了している傾向があるようです。逆に言えば、あまり移動できていない時は壁などにぶつかりまくって盾を失って終了しているということです。


 #!/bin/bash
# 乱数で発生させたgnurobotsのコマンドと
# その実行結果をMySQLに登録する

temp=`mktemp ./com.XXXX`
mysql robots << _SQL_
/* テーブルの初期化 */
create table if not exists commands(
 scm_num int,
 seq int,
 command varchar(50) );
create table if not exists results(
 scm_num int,
 Shields int,
 Energy int,
 walk int,
 Shots int,
 Score int);
_SQL_

# マップの生成
cat << _MAP_ >test.map
##########################
#              @         #
#             @@         #
#   #####                #
#             #          #
#     ++      #          #
#    +++      #          #
#    +++      #     $    #
#   ++++                 #
##########################
_MAP_

scm_num=`mysql robots -N << _SQL_ | sed -e "s/NULL//g"
select max(scm_num) from results;
_SQL_`
for ( ( iter=0; iter<5; iter++ ) )
do
scm_num=`expr $scm_num + 1`

# コマンドの生成
./make_scm.sh |\
 awk '{print $2}' |\
 sed -e "s/_/ /g" |\
 tee command.txt |\
 awk -v scm_num="$scm_num" '{printf "%d,%d,%s\n",scm_num,NR,$0}' \
 > $temp
# gnurobotsの実行
gnurobots -e 100 -s 5 command.txt -f test.map \
 2>/dev/null > result.txt
# 結果の整理
Shields=`cat result.txt |  awk '/Shields/ {print $2}' | head -1`
Energy=`cat result.txt |  awk '/Energy/ {print $2}' | head -1`
walk=`cat result.txt |  awk '/Units walked/ {print $3}' | head -1`
Shots=`cat result.txt |  awk '/Shots/ {print $2}' | head -1`
Score=`cat result.txt |  awk '/Score/ {print $2}' | head -1`
echo $scm_num $Shields $Energy $walk $Shots $Score

mysql robots << _SQL_
/* command.txt の登録 */
 load data local infile '$temp'
  into table commands
  fields terminated by ','
  (scm_num,seq,command);
/* result.txt の登録 */
 insert into results
  (scm_num,Shields,Energy,walk,Shots,Score)
  value
  ($scm_num,$Shields,$Energy,$walk,$Shots,$Score);
_SQL_

done
rm $temp


make_scm.sh

#!/bin/bash
# 配列の定義
# 配分表のhirituの割合でitemが出力される
declare -a item=(\
 `cat distribution.tab |\
  awk '{print $1}'`\
)
declare -a hiritu=(\
 `cat distribution.tab |\
  awk '{print $2}'`\
)
declare -a ruiseki
# n_arrayは配列の数
n_array=${#hiritu[*]}

ruiseki[0]=0
for ( ( i=0; i<$n_array; i++ ) )
do
 ruiseki[`expr $i + 1`]=`expr ${ruiseki[$i]} + ${hiritu[$i]}`
done
for ( ( i=0; i<=$n_array; i++ ) )
do
 ruiseki[$i]=`bc  << _BC_
  32767 * ${ruiseki[$i]} / ${ruiseki[${n_array}]}
_BC_`
done
# 配列ruisekiの中には0〜32767をhirituに応じて配分している

for ( ( count=0; count<50; count++ ) )
do
# 一様乱数randを発生させ、reuiseki(i)<=rand<(i+1)なら
# item(i)を表示する
 rand=$( ( $RANDOM ) )
 for ( ( i=0; i<$n_array; i++ ) )
 do
 if [ ${ruiseki[$i]} -le $rand ] && [ $rand -lt ${ruiseki[`expr $i + 1`]} ]
 then
  echo $rand ${item[$i]}
 fi
 done
done


distribution.tab

(robot-turn_1)    2
(robot-turn_-1)    2
(robot-move_1)    5
(robot-zap)    1
(robot-grab)    1

ubuntu16とMySQL5.7

OSとMYSQLのバージョンを同時に上げてしまったので、どっちの影響なのかわからないのですが、インストールしても

user@PC-UBUNTU64:~$ mysql -u root -p
Enter password:
ERROR 1698 (28000): Access denied for user 'root'@'localhost'

となってMySQLが起動しなくなってしまいました。

mysqld_safeも上手く動かないし困っていたところ、

$ sudo mysql

で、あっさりと起動してしまいました。

このときMYSQLは管理者権限でログインしていることになっているので、すかさず別のユーザーを作成することで、従来通り

$ mysql

だけで起動できるようになりました。

近い将来メインPCをバージョンアップするときのための備忘録です。

比率に応じた乱数の発生

distribution.tabファイルを

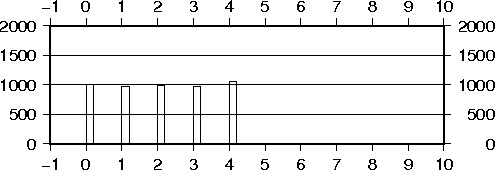
0 1
1 1
2 1
3 1
4 1

とすると、1:1:1:1:1の割合で0、1、2、3、4が出力される。ヒストグラムにすると

f:id:S_E_Hyphen:20170414111552j:plain

同じく

0 1
1 1
2 2
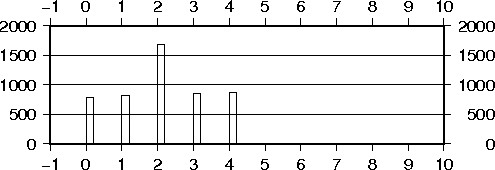
3 1
4 1

にすると、1:1:2:1:1となる。

f:id:S_E_Hyphen:20170414111704j:plain

0 1
1 1
2 1
3 1
4 3
9 1

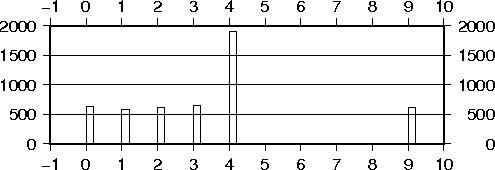
みたいに間が飛んでいても大丈夫。


f:id:S_E_Hyphen:20170414111926j:plain


#!/bin/bash
# 配列の定義
# 配分表のhirituの割合でitemが出力される
declare -a item=(\
 `cat distribution.tab |\
  awk '{print $1}'`\
)
declare -a hiritu=(\
 `cat distribution.tab |\
  awk '{print $2}'`\
)
declare -a ruiseki
# n_arrayは配列の数
n_array=${#hiritu[*]}

ruiseki[0]=0
for ( ( i=0; i<$n_array; i++ ) )
do
 ruiseki[`expr $i + 1`]=`expr ${ruiseki[$i]} + ${hiritu[$i]}`
done
for ( ( i=0; i<=$n_array; i++ ) )
do
 ruiseki[$i]=`bc  << _BC_
  32767 * ${ruiseki[$i]} / ${ruiseki[${n_array}]}
_BC_`
done
# 配列ruisekiの中には0〜32767をhirituに応じて配分している

for ( ( count=0; count<5000; count++ ) )
do
# 一様乱数randを発生させ、reuiseki(i)<=rand<reuiseki(i+1)なら
# item(i)を表示する
 rand=$( ( $RANDOM ) )
 for ( ( i=0; i<$n_array; i++ ) )
 do
 if [ ${ruiseki[$i]} -le $rand ] && [ $rand -lt ${ruiseki[`expr $i + 1`]} ]
 then
  echo $rand ${item[$i]}
 fi
 done
done |\
 awk '{print $2}' |\
 gmt pshistogram /dev/stdin -W0.2 -L -JX10c/3c -R-1/10/0/2000 -B1/a500g500 > histgram.ps
gmt ps2raster histgram.ps -E100 -P -A

# 最後2行はGMTを使って描画している


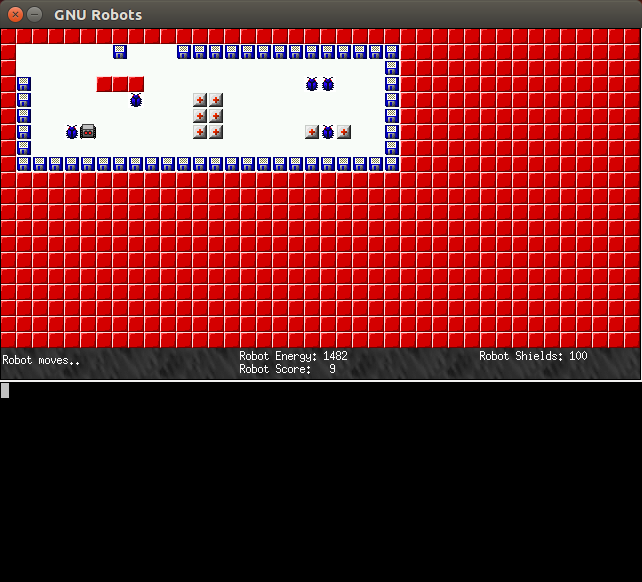
gnurobots

Scheme言語でロボットを操って得点を競うゲームだそうです。

f:id:S_E_Hyphen:20170408162321p:plain

「報酬」を捕ったらScoreが1加算されます。

「餌」を食ったらEnergyが10?加算されます。

逆に「壁」や「敵」に突っ込んだらShieldが1枚減るようです。


とりあえず乱数で酔歩運動させてみました。

効率は無茶苦茶悪いけど、一応「報酬」や「餌」だけを食べているみたいです。

pythonの前にSchemeを覚えなくてはならなくなりました。


;;; 乱数 ;;;;;;;;;;;;;;
(define obj " ")
; 種 (seed)
(define *seed* 1)
; シードの設定
(define (srand x)
    (set! *seed* x))
; 整数の一様乱数
(define (irand)
    (set! *seed* (modulo (+ (* 69069 *seed*) 1) #x100000000))
    *seed*)
; 実数の一様乱数
(define (random)
    (* (/ 1.0 #x100000000) (irand)))
(define (make-number n)
    (+ (modulo (quotient (irand) #x10000) n) 1))
;;;;;;;;;;;;;;;;;;;;;;;;

;;; 目前の物体を確認する;;
(define freq '("space" "wall" "baddie" "food" "prize"))
(define (grope-things freq)
  (if (null? freq) #f
    (if (robot-feel (car freq))
      (car freq)
      (grope-things (cdr freq))
    )
  )
)
;;;;;;;;;;;;;;;;;;;;;;;;

;;; 処理の定義 ;;;;;;;;;;
(define (grab-prize)
  (robot-grab)
  (robot-move 1)
  (robot-turn (make-number 4))
)
(define (grab-food)
  (robot-grab)
  (robot-move 1)
  (robot-turn (make-number 4))
)
(define (turn-wall)
  (robot-turn (make-number 4))
)
(define (go-space)
  (robot-move 1)
  (robot-turn (make-number 4))
)
(define (zap-baddie)
  (robot-zap)
  (robot-move 1)
  (robot-turn (make-number 4))
)
;;;;;;;;;;;;;;;;;;;;;;;;

;; メインループ ;;;;;;;;;;
(
define (main-loop)
(set! obj (grope-things freq))
(
cond
 ( (equal? obj "space") (go-space))
 ( (equal? obj "wall") (turn-wall))
 ( (equal? obj "baddie") (zap-baddie))
 ( (equal? obj "food") (grab-food))
 ( (equal? obj "prize") (grab-prize))
)
(main-loop))

(robot-turn 1)
(main-loop)
;;;;;;;;;;;;;;;;;;;;;;;;